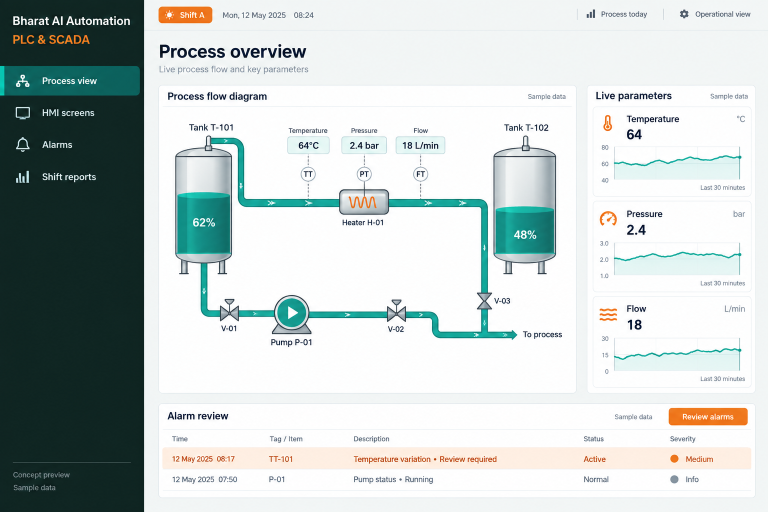
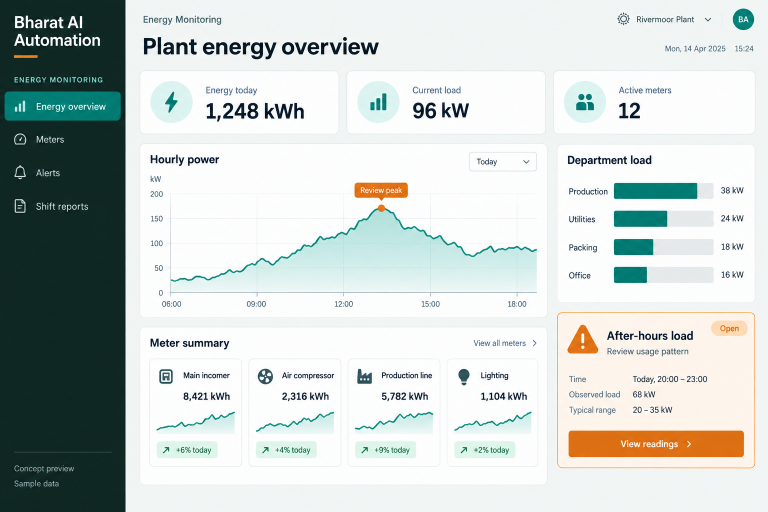
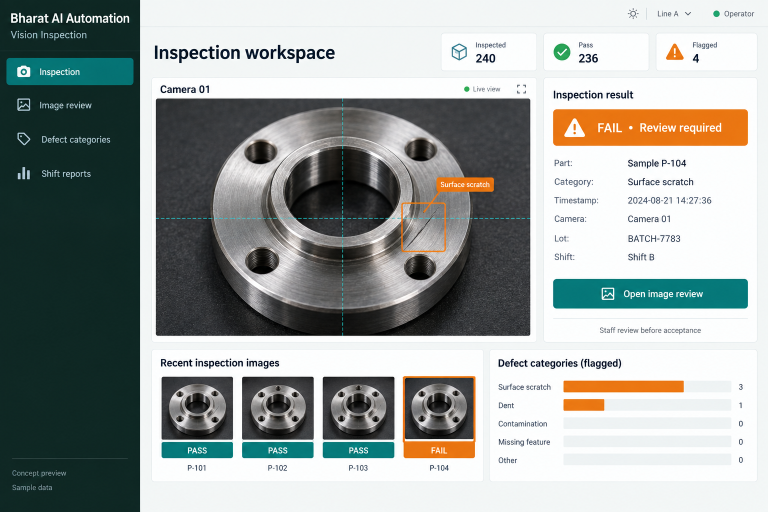
Understand what your machines produced, when they stopped and where the next investigation should begin. Bharat AI Automation connects supported machine and sensor data to live production and OEE dashboards, downtime tracking and shift reports, helping manufacturing teams discuss output and maintenance using a shared record of the shop floor.
A tally collected at the end of the day cannot explain a developing production shortfall.
Short interruptions are easily forgotten when staff reconstruct a shift later.
Production measures become misleading when each team defines operating time or good output differently.
Acquire agreed machine signals through supported interfaces and sensors. The technical assessment identifies what can be measured reliably, which signals already exist and what additional equipment may be required.
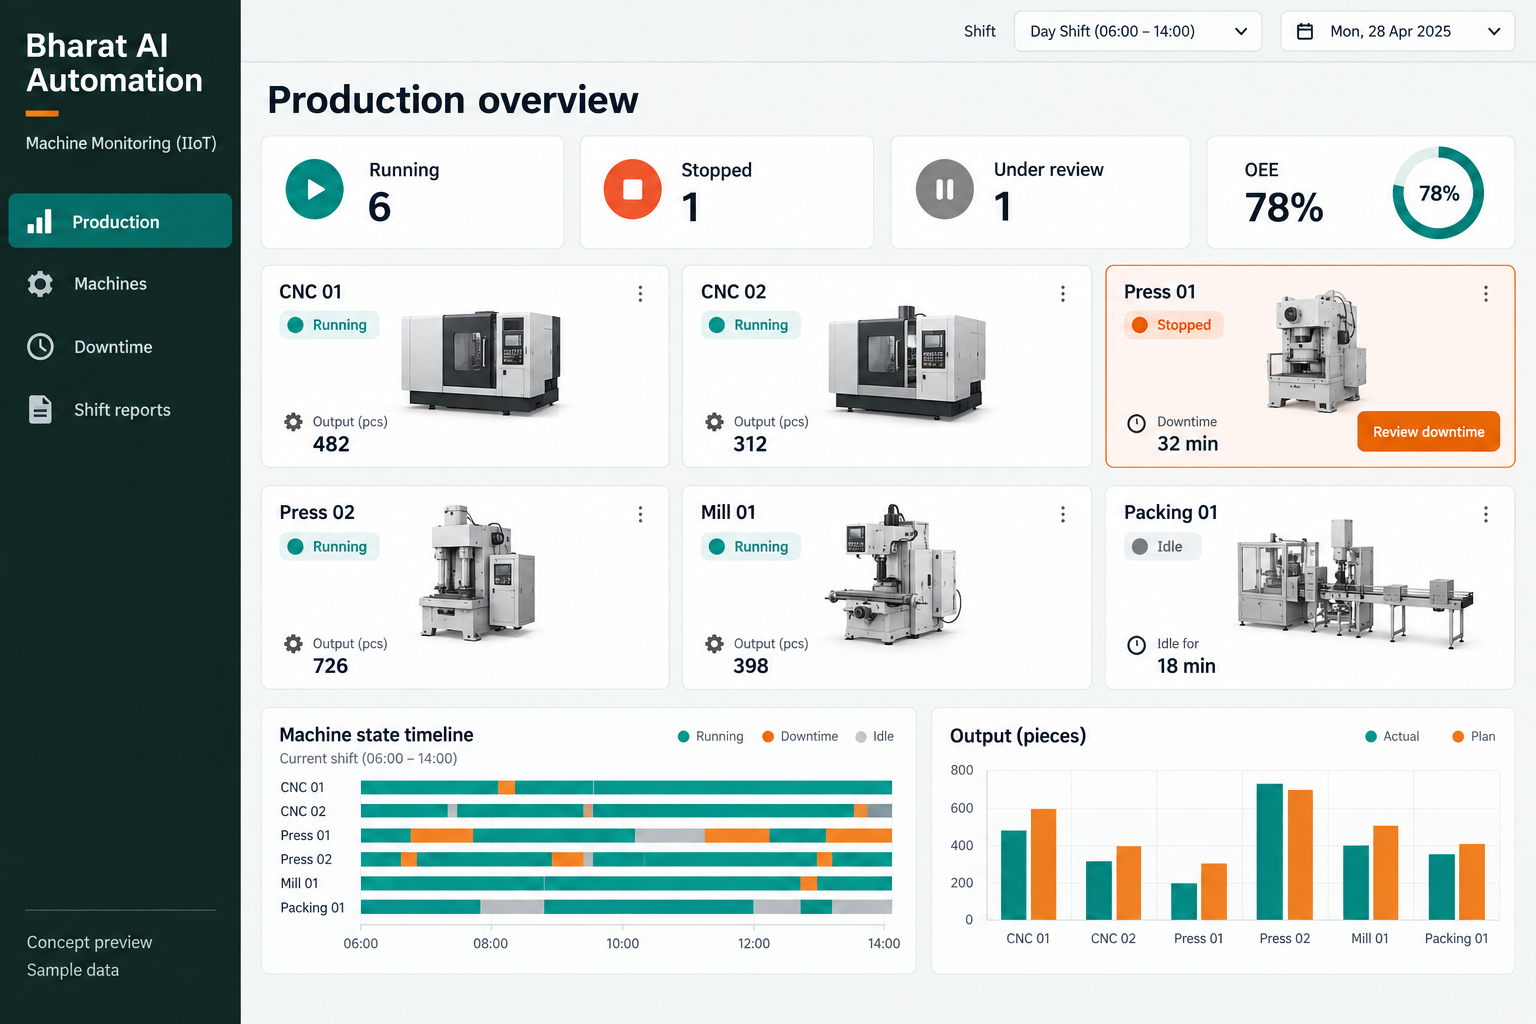
See current production information for the monitored equipment in one view. Supervisors can focus attention on a changed condition and then ask the floor team for the operational context.
Track available running and stopped states and review interruption periods. Agree how downtime context is captured so the team can distinguish operational causes from a missing or unreliable signal.
Present overall equipment effectiveness using the agreed availability, performance and quality inputs. The setup must define planned time, reference rates and good counts before comparisons can be trusted.
Review production and recorded alarms by shift. This creates a consistent conversation between supervisors and maintenance teams when the same interruption appears across several production periods.
Connect the agreed production data with Bharat AI ERP requirements. Define which records move between systems and how the team checks mismatches before treating machine totals as business transactions.
Start with the decisions managers need to make: output gaps, recurring stops or machine utilisation. These questions guide signal selection and prevent collecting readings that nobody uses.
Compare captured counts and states with observations made by responsible plant personnel. Check the meaning of each signal before displaying the resulting production measure to supervisors.
Use the live dashboard to see current machine conditions and output. Staff investigate unusual changes through the agreed shop-floor process rather than assuming every change indicates a fault.
Review downtime and production differences with the operators involved. The recorded timeline supports the discussion, while people provide context about changeovers, materials and other events.
Use shift evidence and advisory alerts to choose a focused investigation. Follow the result across later periods using the same calculation definitions and comparable production conditions.
Use forecasts and alerts to guide your review, with people making the final decisions.
Analyse suitable machine history for patterns that may indicate developing problems. Maintenance personnel review these advisory alerts with equipment condition and inspections; they are not guaranteed predictions of failure.
Estimate likely production from recorded performance patterns. The supervisor should interpret the estimate alongside scheduled changeovers, product mix and material availability before committing to a delivery expectation.
Route configured alerts to supervisors on WhatsApp so relevant changes receive attention. Agree recipients and event criteria during setup to keep the messages useful rather than generating constant interruptions.
Compare recorded output for selected machines and shifts.
Inspect interruption periods to identify repeated loss patterns.
Look at availability, performance and quality separately before interpreting the combined figure.
Bring advisory alerts into regular maintenance discussions.
Bring your existing equipment details. We’ll review compatibility, connectivity and the modules needed for your installation.
Identify representative machines and a small set of production questions. Agree success criteria around data quality and useful reporting before expanding the number of monitored assets.
Agree machine states, planned time, reference rates and quality inputs. Document the assumptions behind each metric so operators and managers interpret the dashboard consistently.
Compare collected information with real production observations across representative conditions. Resolve missing counts or ambiguous states before using the reports for operational decisions.
Train production and maintenance teams to interpret dashboards and advisory alerts. Extend the rollout after the pilot confirms useful data, clear responsibilities and an agreed support process.
Some machines can be monitored using available signals or additional sensors, but this needs an equipment assessment. Machine age alone does not establish compatibility or the measurements that will be possible.
OEE combines availability, performance and quality into one production measure. Its usefulness depends on agreed definitions and reliable inputs, so the individual components should also be reviewed.
Machine states can identify that a stop occurred, but the underlying reason may require operator or maintenance context. Discuss the intended downtime classification process during the demo.
Yes, supervisor alerts are part of the Automation offering. The agreed scope should define which events trigger messages, who receives them and how staff follow up.
Predictive guidance is advisory in this monitoring workflow. Trained personnel retain responsibility for maintenance and critical controls; any separate control integration requires its own engineering scope.
Bring your real tasks and questions. We’ll use them to discuss the right configuration, equipment and rollout.
Bring machine signals, operator screens and production supervision into a coordinated automation project.
Turn meter readings into a useful view of how your plant consumes energy and utilities.
Bring camera-based defect detection into your quality workflow.