/
/
/
Energy Monitoring
BHARAT AI AUTOMATION · ENERGY MONITORING

Energy Monitoring Software

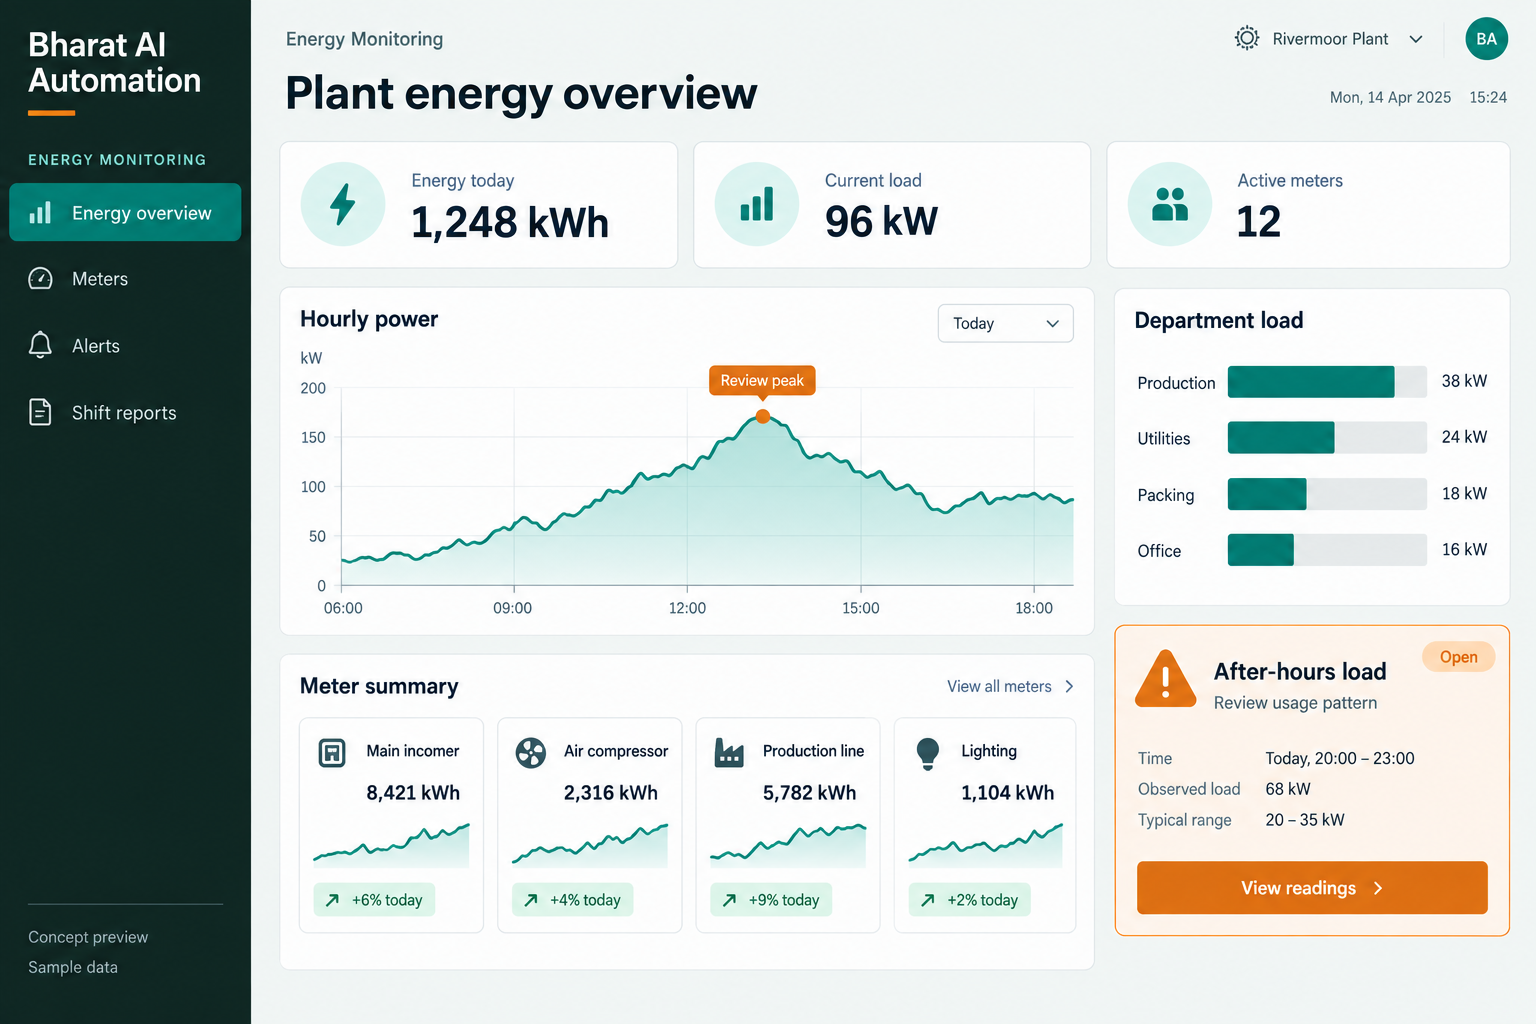
Turn meter readings into a useful view of how your plant consumes energy and utilities. Bharat AI Automation collects supported metering data, presents consumption trends and highlights unusual patterns, helping factories compare shifts, investigate waste and connect energy use with the production conditions that explain it.
● ● ●
Energy Monitoring Software
CONCEPT PREVIEW

Illustrative interface with sample data. Select the image to explore it at full size.

BUILT FOR YOUR BUSINESS

A better fit for your daily work.

Manufacturing plants and engineering units
Textile and rice mills
Food and process factories
Plant utility and maintenance teams

Bills arrive after the opportunity to investigate

A monthly total shows cost but little operating context.

Consumption is disconnected from production

Higher energy use can reflect higher output rather than waste.

Manual readings hide short-term changes

Occasional readings can miss unusual use between inspections.

SOFTWARE CAPABILITIES

Everything your team needs, connected.

01

Energy and utility metering

Collect the readings available from supported meters and sensors. The technical scope confirms which utilities, measurements and interfaces can be included rather than assuming every existing meter is accessible.

02

Consumption dashboards

Present the agreed readings for selected meters or areas. Give supervisors a way to follow changing use without manually combining figures from different displays and notebooks.

03

Time-based trend review

Inspect readings over the periods relevant to your plant. Comparing similar shifts or production conditions helps the team ask focused questions about a change in usage.

04

Production context

Assess the connection between energy information and the available production data. Any consumption-per-output calculation needs aligned time periods, clear units and a shared understanding of what is being counted.

05

Energy alerts

Configure the agreed conditions that should prompt investigation and use AI waste alerts where suitable data exists. The engineering team reviews whether a change is operational, measurement-related or actionable.

06

Shift and management reporting

Bring selected meter data into plant review meetings and shift reports. Use a common reporting period so operations and maintenance teams can compare their observations against the same information.

HOW IT WORKS

From the first task to a clearer daily picture.

01

Map what is measured

Identify existing meters, the areas they represent and the information managers need. Confirm which readings belong to an entire facility and which describe a specific line or utility.

02

Validate the readings

Qualified personnel assess the interfaces and compare collected data with the source meters. Confirm units, timestamps and missing-data handling before managers rely on consumption trends.

03

Establish a comparison period

Review typical operation to understand the plant’s consumption pattern. Use representative production conditions so later comparisons do not mistake a different workload for an unexplained increase.

04

Investigate unusual use

Examine a flagged period alongside production activity, operating schedules and equipment observations. The software directs attention; plant personnel determine the cause and any appropriate action.

05

Track the result

Compare subsequent periods using consistent measurements and operating context. Use the evidence to assess whether a change had the intended effect without assuming all variation is a saving.

AI ASSISTANCE

Useful insights. Your team in control.

Use forecasts and alerts to guide your review, with people making the final decisions.

Energy waste alerts

Identify unusual consumption patterns that may deserve investigation. Alerts are suggestions, and their usefulness depends on metering quality, sufficient history and the consistency of the plant’s operating conditions.

Production-aware review

Discuss how available production patterns can inform consumption analysis. Where the data supports it, this context helps distinguish a busy production period from a potentially unexplained change in energy use.

WhatsApp supervisor alerts

Send configured notifications to the people responsible for utility review. Agree alert criteria and follow-up ownership so a useful signal reaches the right team without creating unnecessary message volume.

REPORTS AND VISIBILITY

A clear view of what matters.

Consumption trends

Review agreed meter readings over selected periods.

Shift comparison

Compare usage across shifts with comparable measurement coverage.

Meter and area breakdown

Review readings according to the agreed meter map.

Alert follow-up

Review the periods that generated consumption alerts and the available operational context.

EQUIPMENT AND SETUP

Made to work with the right tools.

Bring your existing equipment details. We’ll review compatibility, connectivity and the modules needed for your installation.

YOUR SETUP CHECKLIST
GETTING STARTED

A practical plan for moving forward.

01

Metering assessment

Review the meter inventory and required utility coverage with qualified personnel. Identify available interfaces and measurement gaps before agreeing the hardware and installation scope.

02

Reporting design

Define labels, units, comparison periods and production context. Agree who reviews the readings and how missing or questionable data will be handled.

03

Pilot and baseline review

Validate a representative set of readings against source information. Review normal operating patterns with the plant team before setting alert expectations or expanding coverage.

04

Operational handover

Train supervisors to interpret trends and investigate alerts. Agree technical support responsibilities and a review routine that makes the monitoring information useful after installation.

COMMON QUESTIONS

Before you choose your software.

Does this software guarantee energy savings?

No fixed saving is promised. It provides visibility and advisory alerts so your team can investigate consumption. Results depend on the equipment, operating changes and actions taken after review.

Possibly, if their interfaces and available measurements are suitable. Share the model numbers and current metering arrangement so compatibility can be assessed before equipment reuse is confirmed.

This can be scoped when suitable production data is available. Measurements must share meaningful time periods and units; otherwise a consumption-per-output figure can be misleading.

The energy-monitoring workflow provides information and alerts. Any control integration is a separate engineering decision, with trained people retaining responsibility for critical equipment and site procedures.

The monitoring view helps explain operational consumption. Billing reconciliation depends on meter coverage and the utility’s charging basis, so it should not be assumed to replace the supplier’s billing record.

LET’S TALK ABOUT YOUR BUSINESS

See your workflow in action.

Bring your real tasks and questions. We’ll use them to discuss the right configuration, equipment and rollout.

A USEFUL STARTING POINT
KEEP EXPLORING

More ways to support your business.

BHARAT AI AUTOMATION

Understand what your machines produced, when they stopped and where the next investigation should begin.

BHARAT AI AUTOMATION

Bring machine signals, operator screens and production supervision into a coordinated automation project.

BHARAT AI AUTOMATION

Connect selected sensors, meters and devices to a shared operational view.